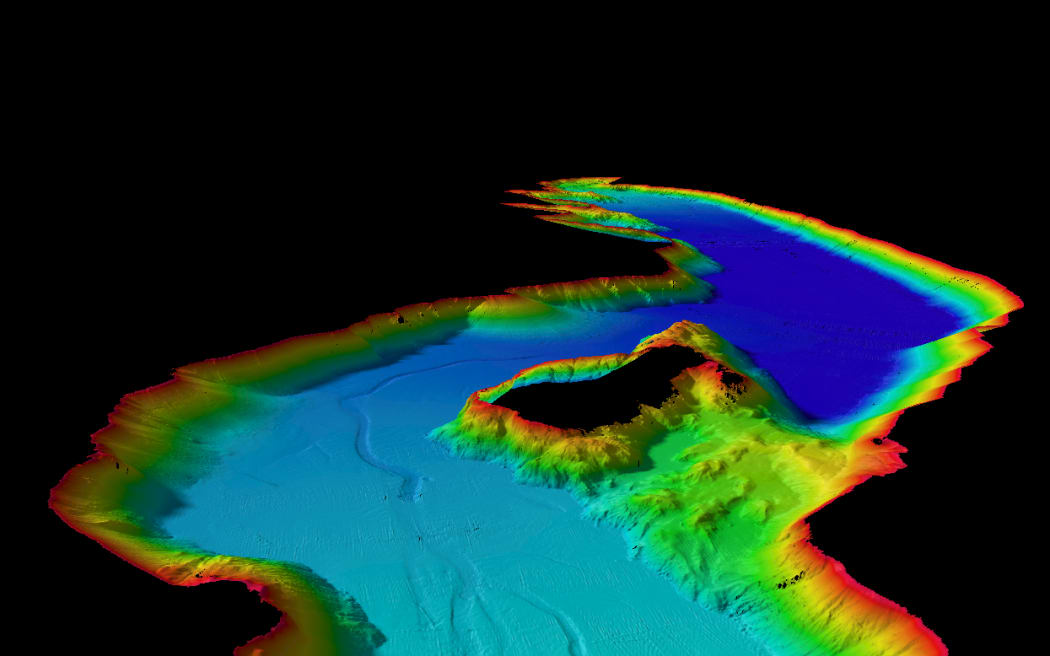
3D graphic of high-resolution bathymetry data retrieved from Wānaka lakebed mapping project. Photo: NIWA / Sam Davidson
Lake Wānaka has been mapped in intricate detail by scientists to better understand the risk of earthquakes and tsunamis.
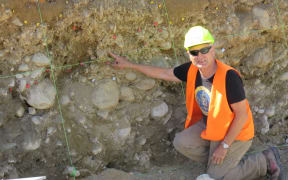
An active fault was discovered under the lake three years ago.
Lake Wānaka is at risk of experiencing a tsunami-like event due to the fault and its geological features, such as steep slopes which could create a landslide and pose a risk to lakefront communities.
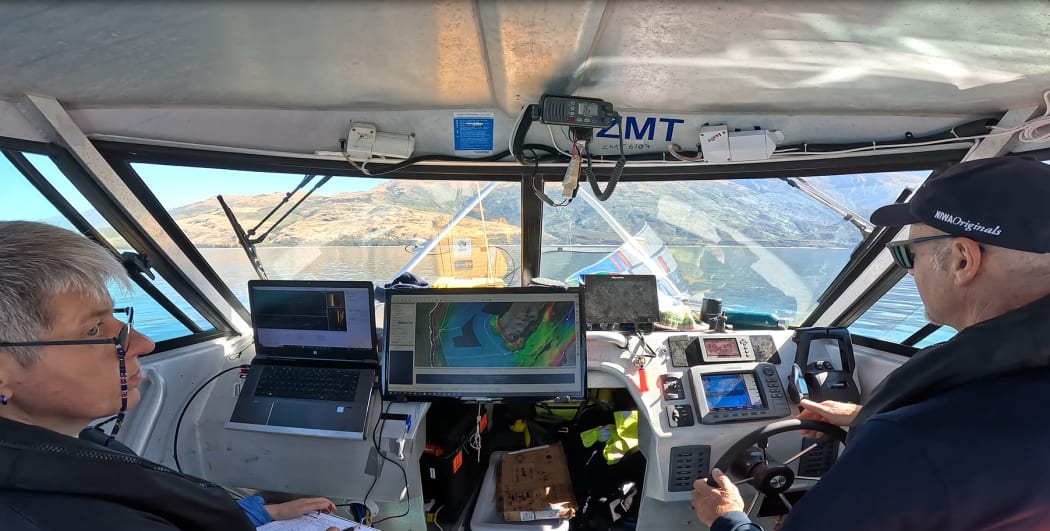
Otago Regional Council natural hazards manager Dr Jean-Luc Payan said the data was invaluable in understand the risk and consequences of such events to people and infrastructure in the area.
National Institute of Water and Atmospheric Research (NIWA) marine geology technician Sam Davidson said the map would allow hazard modellers and councils to better prepare for earthquakes and tsunamis.
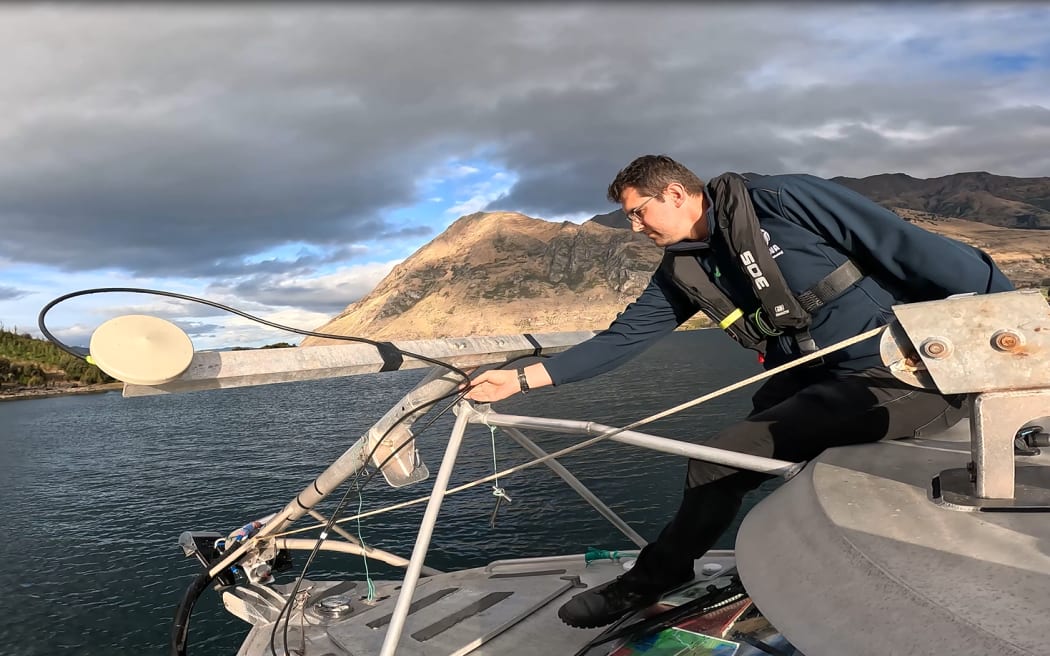
Lake Wānaka mapping project team onboard RV Rukuwai II with multibeam echosounder attached to the bow of the research vessel. Photo: NIWA
The entire lakebed and its structures could now be visualised, Davidson said.
"Lake Wānaka is one of the most photographed locations in the country but until now its depths have remained a mystery. We discovered some really interesting features, including complex channel systems from the rivers that feed into it.
"We also saw dramatic steep slopes that plummet to the deepest parts of the lake. Wānaka sits in a U-shaped valley which was carved by an ancient glacier during the last ice age over 10,000 years ago - these features and the lake's geological history came to life in front of our eyes."
Davidson and his team attached a multibeam echosounder onto a small dive vessel, which they steered up and down the lake over several weeks.
It calculated the water depth by bouncing 10 soundwaves per second off the lakebed and timed how long it took to return.
From that data NIWA built a full 3D model of the entire area.
NIWA hydrodynamics scientist Dr David Plew was using the map to study the lake's water quality.
Lake Wānaka mapping project team onboard RV Rukuwai II with multibeam echosounder attached to the bow of the research vessel. Photo: NIWA
"New Zealand has experienced dramatic changes in land use over the past century, which has had big impacts on our freshwater systems. Nutrient loads, the volume of water, and the amount of sediment going into Lake Wānaka have all been impacted. And climate change is also affecting our lakes and will do so even more in the future," he said.
NIWA developed computer models of the catchment and lake to predict how it would change, until now these models relied on charts created in the 1970s.
"This new depth data that we've captured is more accurate and detailed," Dr Plew said.
"This is especially important in shallow parts of the lake like Roys Bay and Stevensons Inlet, but also where rivers flow into the lake, because these areas have seen some of the biggest impacts and changes since the 1970s."
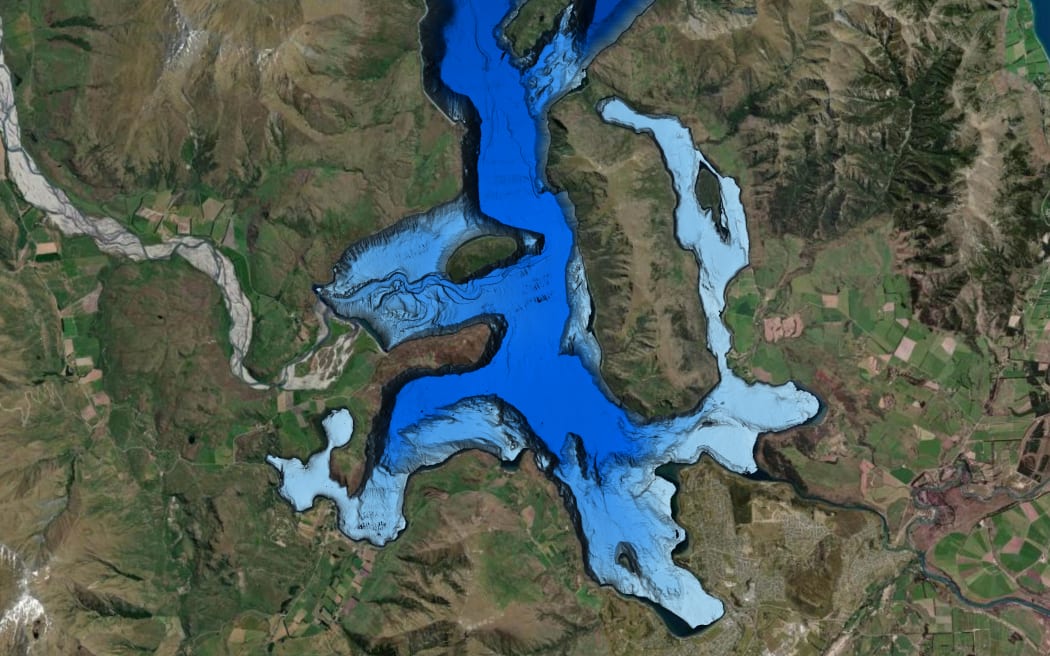
Close-up image of bathymetry data for the southern part of Lake Wānaka. Photo: NIWA / Sam Davidson